![]()
Remotely Access a Free Self-driving Lab Demo
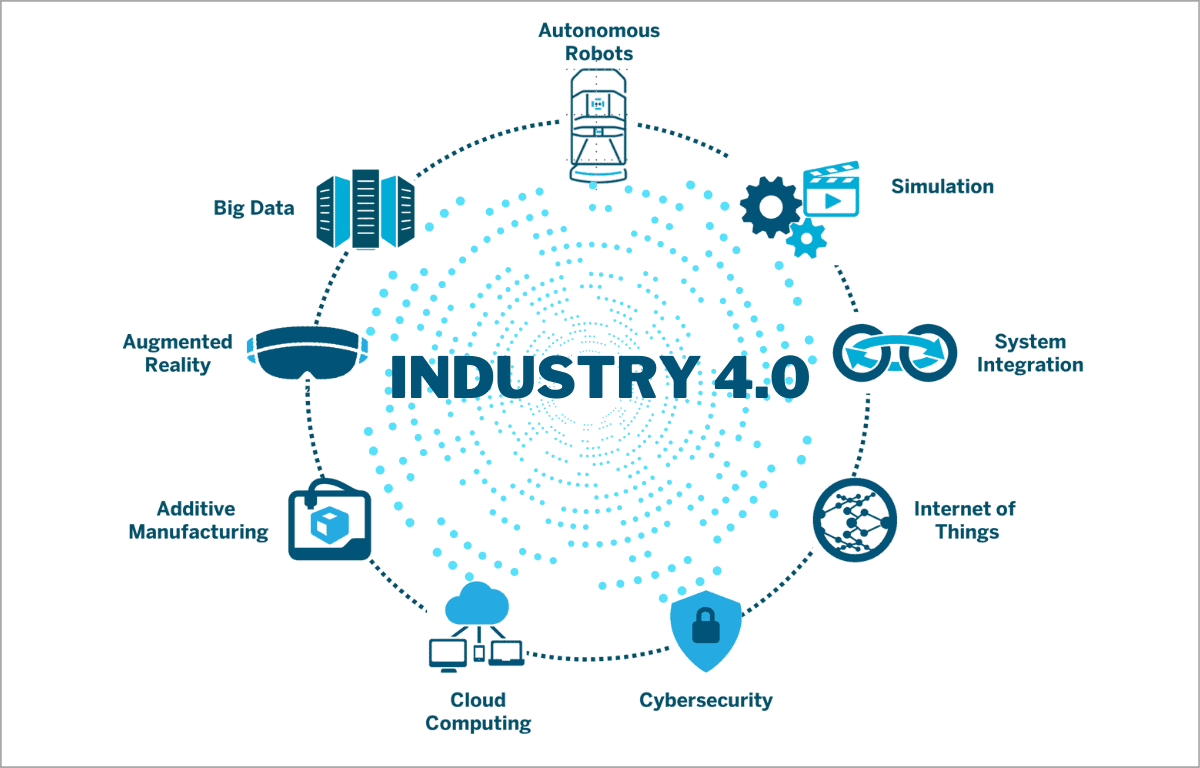
The fourth industrial revolution, or Industry 4.0, “is revolutionizing the way companies manufacture, improve and distribute their products [by] integrating new technologies, including Internet of Things (IoT), cloud computing and analytics, and AI and machine learning into their production facilities and throughout their operations” (IBM).
https://www.calsoft.com/what-is-industry-4-0/
While Industry 4.0 is accelerating the efficiency with which manufacturers develop products and respond to consumer needs, these products are inherently limited by the materials that make them up. Discovery of new materials (plastics, alloys, molecules, drugs) is typically a painstakingly slow process characterized by serendipity and manual trial-and-error. Phrased another way, if Marie Curie were to step into a modern-day chemistry lab, the processes would likely seem very familiar, for example: handheld pipetting and manual mixing.

What do the above materials (insulin, vulcanized rubber, teflon, etc.) have in common? They were discovered accidentally.
What if we could bring the acceleration of Industry 4.0 to scientific research laboratory settings? This is where the concept of “self-driving laboratories” comes in. These are autonomous research laboratories that “learn” from prior experiments using artificial intelligence, automatically carry out the next experiments, and discover new materials in a fraction of the time and at a fraction of the cost. The researcher can then focus on higher-level scientific tasks “such as formulating hypotheses, designing experimental campaigns, and interpreting data” (source).

(source)
Discoveries enabled by self-driving laboratories such as RoboRXN or the increasing number of AC-affiliated materials acceleration platforms can help to address urgent societal needs related to climate change, energy, food, and agriculture.

Ada, a thin-film discovery robot 2. Artificial Chemist for solar cell discovery 3. Robotically reconfigurable flow chemistry platform 4. Chemputer, a computer-driven automated chemistry lab 5. Mobile robot chemist(Video source: Acceleration Consortium)
While the number of self-driving laboratories is increasing, the cost of creating and maintaining a self-driving laboratory is entry-inhibiting. To address this need, there have been many excellent low-cost demos (see below).

Gutierrez, et al., Nat Commun. 5, 5571 (2014). (b) D. Caramelli et al., Nat Commun. 9, 3406 (2018). (c) L. M. Roch et al., PLoS ONE. 15, e0229862 (2020). (d) Tonio Buonassisi. Twitter (2020). (e) F. Yang et al., J. Chem. Educ. 98, 876–881 (2021). (f) J. R. Deneault et al., MRS Bulletin. 46, 566–575 (2021) . (g) L. Saar et al., (2022). (h) Atinary SDLabs Demo. YouTube (2022) .
SDL-Demo: A Low-cost, Easy-to-use, Low-footprint, Self-Driving Lab Demo
Despite the increased accessibility through low-cost demos, for wider adoption, we need something that is even lower cost (< 100 USD), easier to setup (< 1 hr), and that has a smaller footprint (< 1 sq. ft) while retaining key principles of a self-driving laboratory. Our solution is SDL-Demo, a teaching and prototyping platform for self-driving laboratories with an emphasis on principles of accelerating materials discovery. The following table illustrates high-level differences between prior work and SDL-Demo.

Summary of low-cost self-driving lab demos. From left to right: picture of setup, name of group, year, hardware cost in USD, number of design variables, minutes required per iteration/experiment, whether or not custom parts are required, the number of axes, and whether computer vision is used. SDL-Demo has the lowest cost (~50 USD), setup time (no custom parts), and footprint (~4”x4”).
SDL-Demo can be easily set up and paired with optimization algorithms for closed-loop discovery. This is similar to several demos where the task was to mix liquids in order to match a target color; however, in our case we are mixing light instead of matter. While this demo does not explicitly involve chemistry or materials science, key concepts of self-driving laboratories focused on materials discovery are retained: sending commands to hardware, reading data from sensors, using optimization algorithms to suggest next experiments, and optionally incorporating physics-based simulations to inform the optimization process.

SDL-Demo summary. A microcontroller (Raspberry Pi (RPi)) sends commands to a dimmable LED. A spectrophotometer measures the light signal. The microcontroller reads the intensity values from the spectrophotometer. An AI algorithm uses these newly measured values and prior information to choose the next set of LED parameters to better match a target spectrum (i.e. light-based color-matching demo).
The value of SDL-Demo is that it retains the principles of high-cost implementations in a low-cost setting and that it can be used for low-cost prototyping of self-driving laboratory concepts and extensions.
Your Turn to Remotely Access an SDL-Demo
The SDL-Demo platform is open-source and can be easily modified to suit your needs, including for teaching demonstrations and low-cost prototyping. To illustrate this, there is an SDL-Demo located in Salt Lake City, UT (active as of 2022-09-12) that is remotely accessible as a cloud-based experiment that multiple people can use simultaneously. See the image below for a picture of the SDL-Demo setup.

Getting Started
The following code lets you run this SDL-Demo remotely from your browser! You can run cells one at a time using the play button to the left of each cell, or you can run all cells sequentially using “Runtime” –> “Run all” via the menu bar.
Each experiment is on the order of a few seconds, and if multiple people are requesting experiments at the same time, the experiments will be carried out in the order they’re received (first-in-first-out or FIFO).
First, let’s install the self_driving_lab_demo Python package.
[1]:
try:
  import google.colab
  IN_COLAB = True
  %pip install git+https://github.com/sparks-baird/self-driving-lab-demo.git # latest
  # %pip install self-driving-lab-demo # uncomment for stable release
except:
  IN_COLAB = False
Next, we’ll import the SelfDrivingLabDemo class and instantiate it. We’ll pass an observation function compatible with MQTT (i.e. the interface that makes this demo cloud-accessible), the pico ID (pico_id), and a session ID (session_id).
The pico ID is a unique identifer for the microcontroller (e.g. a123b456), but is hardcoded to the value of "test" for both the remotely accessible SDL-Demo and this notebook (i.e. just for this public demonstration). If you run into problems with using the physical test demo, you can also check the box for dummy (i.e., set dummy=True), which will run a very basic simulation in place of running a physical experiment on the hardware. Normally, the results are logged to a database,
but to keep the time per iteration smaller, we skip that in this tutorial. To turn this back on, check the log_to_database variable (i.e., set log_to_database=True).
To make sure that experiments that are requested at the same time don’t get mixed up, an experiment ID (experiment_id) is generated internally for each experiment. We can also pass a session ID (session_id) to make it easier to distinguish experiments from multiple sessions, though in-depth treatment of database management is planned for a separate tutorial (TBD).
Recently, HiveMQ Cloud changed such that `hivemq-com-chain.der` (a Certificate Authority (CA) file) is not transferrable across different broker instances. The [latest `hivemq-com-chain.der` file](https://raw.githubusercontent.com/sparks-baird/self-driving-lab-demo/main/src/public_mqtt_sdl_demo/hivemq-com-chain.der) from [`self-driving-lab-demo`](https://github.com/sparks-baird/self-driving-lab-demo) will be hard-coded to the `self-driving-lab-demo` public test credentials (i.e., what is used in Module 1 - Running the Demo), so the *tutorials* should run without issue as long as you are using that file. However, the *assignment* requires you to have your own HiveMQ Cloud broker instance, so you will need to [generate a `hivemq-com-chain.der` file specific to your instance](https://colab.research.google.com/github/sparks-baird/self-driving-lab-demo/blob/main/notebooks/7.2.1-hivemq-openssl-certificate.ipynb) and upload it to your microcontroller in place of the default one.
[2]:
from uuid import uuid4  # universally unique identifier
from self_driving_lab_demo import (
    SelfDrivingLabDemoLight,
    mqtt_observe_sensor_data,
    get_paho_client,
)
import numpy as np

PICO_ID = "test"  # @param {type:"string"}
dummy = False  # @param {type:"boolean"}
log_to_database = False  # @param {type:"boolean"}
SESSION_ID = str(uuid4())  # random session ID
print(f"session ID: {SESSION_ID}")
rng = np.random.default_rng()  # random number generator

# You can change the values below to set the target color (keep below 89, 255 is very bright)
R_target = 75  # @param {type:"integer"}
G_target = 10  # @param {type:"integer"}
B_target = 56  # @param {type:"integer"}

target_inputs = {"R": R_target, "G": G_target, "B": B_target}

# instantiate client once and reuse (to avoid opening too many connections)
client = get_paho_client(
    f"sdl-demo/picow/{PICO_ID}/as7341/",
    username="sgbaird",
    password="D.Pq5gYtejYbU#L",
    hostname="248cc294c37642359297f75b7b023374.s2.eu.hivemq.cloud",
)

sdl = SelfDrivingLabDemoLight(
    autoload=True,  # perform target data experiment automatically
    target_inputs=target_inputs,  # if None, then defaults to random color using `target_seed` attribute
    random_rng=rng,
    target_seed=604523,  # change to get different random target color (if `target_inputs` is None)
    simulation=dummy,  # run simulation instead of physical experiment
    observe_sensor_data_fn=mqtt_observe_sensor_data,  # (default)
    observe_sensor_data_kwargs=dict(
        pico_id=PICO_ID,
        session_id=SESSION_ID,
        client=client,
        mongodb=log_to_database,
    ),
)
session ID: 1011eafb-7373-4b6f-8c31-7bfaa7dc30a2
Next, we’ll observe the sensor data for the following red/green/blue (RGB) values.
[3]:
sdl.observe_sensor_data({"R": 0, "G": 55, "B": 0})
[3]:
{'utc_time_str': '2024-4-4 16:40:09',
 'utc_timestamp': 1712248809,
 'ch470': 6736,
 'ch550': 1351,
 'ch670': 514,
 'ch410': 245,
 'logged_to_mongodb': False,
 'background': {'ch583': 167,
  'ch670': 277,
  'ch510': 392,
  'ch410': 71,
  'ch620': 210,
  'ch470': 2280,
  'ch550': 375,
  'ch440': 486},
 'ch620': 444,
 'sd_card_ready': True,
 'ch510': 9353,
 'warning': 'Failed to write to SD card: Traceback (most recent call last):\n  File "/lib/sdl_demo_utils.py", line 210, in write_to_sd_card\n  File "/lib/data_logging.py", line 72, in write_payload_backup\nOSError: [Errno 13] EACCES\n',
 'ch583': 378,
 'device_nickname': 'For MongoDB, enter whatever name you want here (optional)',
 'ch440': 572,
 'onboard_temperature_K': 307.2166,
 'encrypted_device_id_truncated': 'test'}
The microcontroller will briefly turn the LED green and collect the data from the spectrophotometer, then publish this data to the HiveMQ MQTT server, the go-between for the microcontroller and this notebook.

“Hello, World!” of Optimization
Now, let’s do the “Hello, World!” of optimization tasks and compare grid search vs. random search vs. Bayesian optimization. If you don’t know what those are, see this Towards Data Science Post. This is the artificial intelligence (though grid and random are “uninformed” methods) that suggests what experiment to run next. We will use the predefined search space shown below with the RGB values
are capped to 35% power since 100% power can be painful to look directly at for a Neopixel LED, but you can still manually send commands that use RGB values up to 255. Note that atime, astep, and gain (sensor parameters) are fixed for the following search campaigns.
[4]:
sdl.bounds
[4]:
{'R': [0, 89],
 'G': [0, 89],
 'B': [0, 89],
 'atime': [0, 255],
 'astep': [0, 65534],
 'gain': [0.5, 512]}
Run Search Algorithms
Next, we’ll use some convenience functions to run each of the searches. The following cell may take approximately 20 minutes to run. The ax_bayesian_optimization function uses the Ax Platform to run Bayesian optimization.
[5]:
%%time
from self_driving_lab_demo.utils.search import (
    grid_search,
    random_search,
    ax_bayesian_optimization,
)

num_iter = 27

print("Starting grid search...")
grid, grid_data = grid_search(sdl, num_iter)
print("Starting random search...")
random_inputs, random_data = random_search(sdl, num_iter)
print("Starting Bayesian optimization...")
best_parameters, values, experiment, model = ax_bayesian_optimization(sdl, num_iter)
Starting grid search...
Starting random search...
[INFO 04-04 12:43:59] ax.service.utils.instantiation: Inferred value type of ParameterType.INT for parameter R. If that is not the expected value type, you can explicitly specify 'value_type' ('int', 'float', 'bool' or 'str') in parameter dict.
[INFO 04-04 12:43:59] ax.service.utils.instantiation: Inferred value type of ParameterType.INT for parameter G. If that is not the expected value type, you can explicitly specify 'value_type' ('int', 'float', 'bool' or 'str') in parameter dict.
[INFO 04-04 12:43:59] ax.service.utils.instantiation: Inferred value type of ParameterType.INT for parameter B. If that is not the expected value type, you can explicitly specify 'value_type' ('int', 'float', 'bool' or 'str') in parameter dict.
[INFO 04-04 12:43:59] ax.service.utils.instantiation: Created search space: SearchSpace(parameters=[RangeParameter(name='R', parameter_type=INT, range=[0, 89]), RangeParameter(name='G', parameter_type=INT, range=[0, 89]), RangeParameter(name='B', parameter_type=INT, range=[0, 89])], parameter_constraints=[]).
[INFO 04-04 12:43:59] ax.modelbridge.dispatch_utils: Using Models.BOTORCH_MODULAR since there is at least one ordered parameter and there are no unordered categorical parameters.
[INFO 04-04 12:43:59] ax.modelbridge.dispatch_utils: Calculating the number of remaining initialization trials based on num_initialization_trials=None max_initialization_trials=None num_tunable_parameters=3 num_trials=None use_batch_trials=False
[INFO 04-04 12:43:59] ax.modelbridge.dispatch_utils: calculated num_initialization_trials=6
[INFO 04-04 12:43:59] ax.modelbridge.dispatch_utils: num_completed_initialization_trials=0 num_remaining_initialization_trials=6
[INFO 04-04 12:43:59] ax.modelbridge.dispatch_utils: `verbose`, `disable_progbar`, and `jit_compile` are not yet supported when using `choose_generation_strategy` with ModularBoTorchModel, dropping these arguments.
[INFO 04-04 12:43:59] ax.modelbridge.dispatch_utils: Using Bayesian Optimization generation strategy: GenerationStrategy(name='Sobol+BoTorch', steps=[Sobol for 6 trials, BoTorch for subsequent trials]). Iterations after 6 will take longer to generate due to model-fitting.
[INFO 04-04 12:43:59] ax.service.managed_loop: Started full optimization with 27 steps.
[INFO 04-04 12:43:59] ax.service.managed_loop: Running optimization trial 1...
Starting Bayesian optimization...
[INFO 04-04 12:44:03] ax.core.experiment: Attached data has some metrics ({'rmse', 'mae'}) that are not among the metrics on this experiment. Note that attaching data will not automatically add those metrics to the experiment. For these metrics to be automatically fetched by `experiment.fetch_data`, add them via `experiment.add_tracking_metric` or update the experiment's optimization config.
[INFO 04-04 12:44:03] ax.service.managed_loop: Running optimization trial 2...
[INFO 04-04 12:44:06] ax.core.experiment: Attached data has some metrics ({'rmse', 'mae'}) that are not among the metrics on this experiment. Note that attaching data will not automatically add those metrics to the experiment. For these metrics to be automatically fetched by `experiment.fetch_data`, add them via `experiment.add_tracking_metric` or update the experiment's optimization config.
[INFO 04-04 12:44:06] ax.service.managed_loop: Running optimization trial 3...
[INFO 04-04 12:44:10] ax.core.experiment: Attached data has some metrics ({'rmse', 'mae'}) that are not among the metrics on this experiment. Note that attaching data will not automatically add those metrics to the experiment. For these metrics to be automatically fetched by `experiment.fetch_data`, add them via `experiment.add_tracking_metric` or update the experiment's optimization config.
[INFO 04-04 12:44:10] ax.service.managed_loop: Running optimization trial 4...
[INFO 04-04 12:44:14] ax.core.experiment: Attached data has some metrics ({'rmse', 'mae'}) that are not among the metrics on this experiment. Note that attaching data will not automatically add those metrics to the experiment. For these metrics to be automatically fetched by `experiment.fetch_data`, add them via `experiment.add_tracking_metric` or update the experiment's optimization config.
[INFO 04-04 12:44:14] ax.service.managed_loop: Running optimization trial 5...
[INFO 04-04 12:44:19] ax.core.experiment: Attached data has some metrics ({'rmse', 'mae'}) that are not among the metrics on this experiment. Note that attaching data will not automatically add those metrics to the experiment. For these metrics to be automatically fetched by `experiment.fetch_data`, add them via `experiment.add_tracking_metric` or update the experiment's optimization config.
[INFO 04-04 12:44:19] ax.service.managed_loop: Running optimization trial 6...
[INFO 04-04 12:44:23] ax.core.experiment: Attached data has some metrics ({'rmse', 'mae'}) that are not among the metrics on this experiment. Note that attaching data will not automatically add those metrics to the experiment. For these metrics to be automatically fetched by `experiment.fetch_data`, add them via `experiment.add_tracking_metric` or update the experiment's optimization config.
[INFO 04-04 12:44:23] ax.service.managed_loop: Running optimization trial 7...
[INFO 04-04 12:44:28] ax.core.experiment: Attached data has some metrics ({'rmse', 'mae'}) that are not among the metrics on this experiment. Note that attaching data will not automatically add those metrics to the experiment. For these metrics to be automatically fetched by `experiment.fetch_data`, add them via `experiment.add_tracking_metric` or update the experiment's optimization config.
[INFO 04-04 12:44:28] ax.service.managed_loop: Running optimization trial 8...
[INFO 04-04 12:44:33] ax.core.experiment: Attached data has some metrics ({'rmse', 'mae'}) that are not among the metrics on this experiment. Note that attaching data will not automatically add those metrics to the experiment. For these metrics to be automatically fetched by `experiment.fetch_data`, add them via `experiment.add_tracking_metric` or update the experiment's optimization config.
[INFO 04-04 12:44:33] ax.service.managed_loop: Running optimization trial 9...
[INFO 04-04 12:44:38] ax.core.experiment: Attached data has some metrics ({'rmse', 'mae'}) that are not among the metrics on this experiment. Note that attaching data will not automatically add those metrics to the experiment. For these metrics to be automatically fetched by `experiment.fetch_data`, add them via `experiment.add_tracking_metric` or update the experiment's optimization config.
[INFO 04-04 12:44:38] ax.service.managed_loop: Running optimization trial 10...
[INFO 04-04 12:44:44] ax.core.experiment: Attached data has some metrics ({'rmse', 'mae'}) that are not among the metrics on this experiment. Note that attaching data will not automatically add those metrics to the experiment. For these metrics to be automatically fetched by `experiment.fetch_data`, add them via `experiment.add_tracking_metric` or update the experiment's optimization config.
[INFO 04-04 12:44:44] ax.service.managed_loop: Running optimization trial 11...
[INFO 04-04 12:44:49] ax.core.experiment: Attached data has some metrics ({'rmse', 'mae'}) that are not among the metrics on this experiment. Note that attaching data will not automatically add those metrics to the experiment. For these metrics to be automatically fetched by `experiment.fetch_data`, add them via `experiment.add_tracking_metric` or update the experiment's optimization config.
[INFO 04-04 12:44:49] ax.service.managed_loop: Running optimization trial 12...
[INFO 04-04 12:44:55] ax.core.experiment: Attached data has some metrics ({'rmse', 'mae'}) that are not among the metrics on this experiment. Note that attaching data will not automatically add those metrics to the experiment. For these metrics to be automatically fetched by `experiment.fetch_data`, add them via `experiment.add_tracking_metric` or update the experiment's optimization config.
[INFO 04-04 12:44:55] ax.service.managed_loop: Running optimization trial 13...
[INFO 04-04 12:45:02] ax.core.experiment: Attached data has some metrics ({'rmse', 'mae'}) that are not among the metrics on this experiment. Note that attaching data will not automatically add those metrics to the experiment. For these metrics to be automatically fetched by `experiment.fetch_data`, add them via `experiment.add_tracking_metric` or update the experiment's optimization config.
[INFO 04-04 12:45:02] ax.service.managed_loop: Running optimization trial 14...
[INFO 04-04 12:45:07] ax.core.experiment: Attached data has some metrics ({'rmse', 'mae'}) that are not among the metrics on this experiment. Note that attaching data will not automatically add those metrics to the experiment. For these metrics to be automatically fetched by `experiment.fetch_data`, add them via `experiment.add_tracking_metric` or update the experiment's optimization config.
[INFO 04-04 12:45:07] ax.service.managed_loop: Running optimization trial 15...
[INFO 04-04 12:45:13] ax.core.experiment: Attached data has some metrics ({'rmse', 'mae'}) that are not among the metrics on this experiment. Note that attaching data will not automatically add those metrics to the experiment. For these metrics to be automatically fetched by `experiment.fetch_data`, add them via `experiment.add_tracking_metric` or update the experiment's optimization config.
[INFO 04-04 12:45:13] ax.service.managed_loop: Running optimization trial 16...
[INFO 04-04 12:45:20] ax.core.experiment: Attached data has some metrics ({'rmse', 'mae'}) that are not among the metrics on this experiment. Note that attaching data will not automatically add those metrics to the experiment. For these metrics to be automatically fetched by `experiment.fetch_data`, add them via `experiment.add_tracking_metric` or update the experiment's optimization config.
[INFO 04-04 12:45:20] ax.service.managed_loop: Running optimization trial 17...
[INFO 04-04 12:45:25] ax.core.experiment: Attached data has some metrics ({'rmse', 'mae'}) that are not among the metrics on this experiment. Note that attaching data will not automatically add those metrics to the experiment. For these metrics to be automatically fetched by `experiment.fetch_data`, add them via `experiment.add_tracking_metric` or update the experiment's optimization config.
[INFO 04-04 12:45:25] ax.service.managed_loop: Running optimization trial 18...
[INFO 04-04 12:45:31] ax.core.experiment: Attached data has some metrics ({'rmse', 'mae'}) that are not among the metrics on this experiment. Note that attaching data will not automatically add those metrics to the experiment. For these metrics to be automatically fetched by `experiment.fetch_data`, add them via `experiment.add_tracking_metric` or update the experiment's optimization config.
[INFO 04-04 12:45:31] ax.service.managed_loop: Running optimization trial 19...
[INFO 04-04 12:45:38] ax.core.experiment: Attached data has some metrics ({'rmse', 'mae'}) that are not among the metrics on this experiment. Note that attaching data will not automatically add those metrics to the experiment. For these metrics to be automatically fetched by `experiment.fetch_data`, add them via `experiment.add_tracking_metric` or update the experiment's optimization config.
[INFO 04-04 12:45:38] ax.service.managed_loop: Running optimization trial 20...
[INFO 04-04 12:45:43] ax.core.experiment: Attached data has some metrics ({'rmse', 'mae'}) that are not among the metrics on this experiment. Note that attaching data will not automatically add those metrics to the experiment. For these metrics to be automatically fetched by `experiment.fetch_data`, add them via `experiment.add_tracking_metric` or update the experiment's optimization config.
[INFO 04-04 12:45:43] ax.service.managed_loop: Running optimization trial 21...
[INFO 04-04 12:45:49] ax.core.experiment: Attached data has some metrics ({'rmse', 'mae'}) that are not among the metrics on this experiment. Note that attaching data will not automatically add those metrics to the experiment. For these metrics to be automatically fetched by `experiment.fetch_data`, add them via `experiment.add_tracking_metric` or update the experiment's optimization config.
[INFO 04-04 12:45:49] ax.service.managed_loop: Running optimization trial 22...
[INFO 04-04 12:45:55] ax.core.experiment: Attached data has some metrics ({'rmse', 'mae'}) that are not among the metrics on this experiment. Note that attaching data will not automatically add those metrics to the experiment. For these metrics to be automatically fetched by `experiment.fetch_data`, add them via `experiment.add_tracking_metric` or update the experiment's optimization config.
[INFO 04-04 12:45:55] ax.service.managed_loop: Running optimization trial 23...
[INFO 04-04 12:46:02] ax.core.experiment: Attached data has some metrics ({'rmse', 'mae'}) that are not among the metrics on this experiment. Note that attaching data will not automatically add those metrics to the experiment. For these metrics to be automatically fetched by `experiment.fetch_data`, add them via `experiment.add_tracking_metric` or update the experiment's optimization config.
[INFO 04-04 12:46:02] ax.service.managed_loop: Running optimization trial 24...
[INFO 04-04 12:46:07] ax.core.experiment: Attached data has some metrics ({'rmse', 'mae'}) that are not among the metrics on this experiment. Note that attaching data will not automatically add those metrics to the experiment. For these metrics to be automatically fetched by `experiment.fetch_data`, add them via `experiment.add_tracking_metric` or update the experiment's optimization config.
[INFO 04-04 12:46:07] ax.service.managed_loop: Running optimization trial 25...
[INFO 04-04 12:46:13] ax.core.experiment: Attached data has some metrics ({'rmse', 'mae'}) that are not among the metrics on this experiment. Note that attaching data will not automatically add those metrics to the experiment. For these metrics to be automatically fetched by `experiment.fetch_data`, add them via `experiment.add_tracking_metric` or update the experiment's optimization config.
[INFO 04-04 12:46:13] ax.service.managed_loop: Running optimization trial 26...
[INFO 04-04 12:46:18] ax.core.experiment: Attached data has some metrics ({'rmse', 'mae'}) that are not among the metrics on this experiment. Note that attaching data will not automatically add those metrics to the experiment. For these metrics to be automatically fetched by `experiment.fetch_data`, add them via `experiment.add_tracking_metric` or update the experiment's optimization config.
[INFO 04-04 12:46:18] ax.service.managed_loop: Running optimization trial 27...
[INFO 04-04 12:46:24] ax.core.experiment: Attached data has some metrics ({'rmse', 'mae'}) that are not among the metrics on this experiment. Note that attaching data will not automatically add those metrics to the experiment. For these metrics to be automatically fetched by `experiment.fetch_data`, add them via `experiment.add_tracking_metric` or update the experiment's optimization config.
CPU times: total: 4.22 s
Wall time: 6min 5s
Results
Best error so far vs. iteration
[6]:
#@markdown Let's compare how each optimization algorithm did as a function of the number of
#@markdown iterations. The faster the error goes down, the better.
import plotly.express as px
import pandas as pd
grid_input_df = pd.DataFrame(grid)
grid_output_df = pd.DataFrame(grid_data)[["frechet"]]
grid_df = pd.concat([grid_input_df, grid_output_df], axis=1)
grid_df["best_so_far"] = grid_df["frechet"].cummin()

random_input_df = pd.DataFrame(random_inputs, columns=["R", "G", "B"])
random_output_df = pd.DataFrame(random_data)[["frechet"]]
random_df = pd.concat([random_input_df, random_output_df], axis=1)
random_df["best_so_far"] = random_df["frechet"].cummin()

trials = list(experiment.trials.values())
bayes_input_df = pd.DataFrame([t.arm.parameters for t in trials])
bayes_output_df = pd.Series([t.objective_mean for t in trials], name="frechet").to_frame()
bayes_df = pd.concat([bayes_input_df, bayes_output_df], axis=1)
bayes_df["best_so_far"] = bayes_df["frechet"].cummin()

grid_df["type"] = "grid"
random_df["type"] = "random"
bayes_df["type"] = "bayesian"
df = pd.concat([grid_df, random_df, bayes_df], axis=0)
px.line(df, x=df.index, y="best_so_far", color="type").update_layout(
    xaxis_title="iteration",
    yaxis_title="Best error so far",
)
Data type cannot be displayed: application/vnd.plotly.v1+json
[ ]:
df
Example Output

Observed Points and Corresponding Errors
Let’s take a look at the points that were observed for each of the search algorithms. The axes correspond to red (R), green (G), and blue (B) input values, and the color corresponds to “Fréchet distance” (pronounced like freh-shay). Fréchet distance is a measure of how close the measured spectrum is to the target and should be considered simply as an error metric for this demo. Lower Fréchet distance is better, and zero Fréchet distance is perfect.
[7]:
#@markdown Visualize the grid points that were used for searching.
px.scatter_3d(grid_df, x="R", y="G", z="B", color="frechet", title="grid")
Data type cannot be displayed: application/vnd.plotly.v1+json
Grid Example Output
[8]:
#@markdown Visualize the random points that were used for searching.
px.scatter_3d(random_df, x="R", y="G", z="B", color="frechet", title="random")
Data type cannot be displayed: application/vnd.plotly.v1+json
Random Example Output
[9]:
#@markdown Visualize the points that were explored during Bayesian optimization.
px.scatter_3d(bayes_df, x="R", y="G", z="B", color="frechet", title="Bayesian")
Data type cannot be displayed: application/vnd.plotly.v1+json
Bayesian Example Output
[10]:
# @markdown Finally, we can take a look at how close the best experiments from each algorithm
# @markdown compare to the true target inputs. You may need to rotate the image to get a
# better view.

target_inputs = sdl.get_target_inputs()
true_inputs = pd.DataFrame(
    {key: target_inputs[key] for key in target_inputs}, index=[0]
)
true_inputs["type"] = "true"
best_grid_inputs = grid_df.iloc[grid_df["frechet"].idxmin()][["R", "G", "B", "type"]]
best_random_inputs = random_df.iloc[random_df["frechet"].idxmin()][
    ["R", "G", "B", "type"]
]
best_bayes_inputs = bayes_df.iloc[bayes_df["frechet"].idxmin()][["R", "G", "B", "type"]]

best_df = pd.concat([best_grid_inputs, best_random_inputs, best_bayes_inputs], axis=1).T
best_df["marker"] = "observed"
true_inputs["marker"] = "target"
best_df = pd.concat([best_df, true_inputs], axis=0)
bnds = sdl.bounds
fig = px.scatter_3d(
    best_df, x="R", y="G", z="B", color="type", symbol="marker", title="best"
).update_layout(
    scene=dict(
        xaxis=dict(
            nticks=4,
            range=[bnds["R"][0], bnds["R"][1]],
        ),
        yaxis=dict(
            nticks=4,
            range=[bnds["G"][0], bnds["G"][1]],
        ),
        zaxis=dict(
            nticks=4,
            range=[bnds["B"][0], bnds["B"][1]],
        ),
    ),
)
fig.update_traces(marker={"opacity": 0.75})
fig.data[-1].marker.symbol = "diamond-open"
fig
Data type cannot be displayed: application/vnd.plotly.v1+json
Best Points vs. True RGB
Next Steps
🔰 To see where it started, read the Matter white paper 🔰
Baird, S. G.; Sparks, T. D. What Is a Minimal Working Example for a Self-Driving Laboratory? Matter 2022, 5 (12), 4170–4178. https://doi.org/10.1016/j.matt.2022.11.007.
🏗️ To create your own CLSLab:Light, see the video build instructions and the Star Protocols manuscript 🏗️
Baird, S. G.; Sparks, T. D. Building a “Hello World” for Self-Driving Labs: The Closed-Loop Spectroscopy Lab Light-Mixing Demo. STAR Protocols 2023, 4 (2), 102329. https://doi.org/10.1016/j.xpro.2023.102329.
💡 To learn more about the potential uses of CLSLab:Light, see the notebooks 💡
💬 To participate in discussions about self-driving lab topics, low-cost SDLs, and demo extensions, see the Discussions Page 💬
🛠️ For a nitty-gritty dive into how it works, see the source code 🛠️